New Report Details Characteristics of Uninsured Adult Men by Race/Ethnicity

main_composite

In a new data brief from the Office of Minority Health, analysis of the 2012 American Community Survey Public Use Microdata Sample found disparities remain for ethnic minority adult males aged 19-64. Key findings from the report include:

  • Across all age groups, Latinos had the highest percentage of uninsured compared to African- Americans, Asians, and non-Hispanic Whites.
  • Approximately 40 percent of African-American and Latino males aged 35 and younger are uninsured.
  • Over 70 percent of African-American and non-Hispanic White males, and 60 percent of Asian and Lation males who are uninsured have a high school diploma.
  • Almost half of Asian uninsured male adults are married.
  • Among uninsured adult males, 28 percent Asian and 24 percent Latinos live in Limited English Proficient households.
  • Approximately 60 percent of African-American, 39 percent Latino,  39 percent non-Hispanic White, and 38 percent Asian report a family household income at 100 percent Federal Poverty Level.
  • African-American and non-Hispanic White uninsured adult males report highest percentages of disability.

Based on these findings, the data brief’s authors recommend using this data to better inform targeted outreach and enrollment efforts towards this uninsured population. Additionally, the Affordable Care Act and ability for young adults up to the age of 26 to obtain coverage from their parents’ insurance can help reduce this uninsurance gap.

Joanne Chan, Joint Center Graduate Scholar, Harvard School of Public Health


New Report Details Adult Californians’ health by race and ethnicity

????????????????????????????????????????????????


The UCLA Center for Health Policy Research released findings from analyses of 2011-12 California Health Interview Survey on various health indicators among adult Californians, including insurance status, nutrition, clinical health outcomes, health behaviors, food insecurity, and English proficiency. Health profiles were published for all racial groups (Non-Hispanic White, Lation, Black, Asian, and American Indian/Alaska Native) and provided disaggregated data for the Asian and Latino communities.

Among the Asian community,

  • 60 percent had employer-based health insurance (compared to 50% of Californian overall). After disaggregating by ethnicity, 39.8% of Koreans had employer-based insurance, 43.6% of Vietnamese, 60.6% Chinese, 66.3% Filipino, 69.8% Japanese, and 73.6% South Asian. “Other Asian” were 47.6% employer-based insured.
  • 21.5% engaged in binge drinking, with the highest percentage among Filipino (31.1%) and lowest percentage among Vietnamese (13.9%).
  • Eight percent reported having food insecurity, with the highest percentage among Vietnamese (15.6%) and the lowest among Japanese (2.5%).

Within the Latino population,

  • Fewer than 40% had employer-based health insurance, with Guatemalans having a 20% employer-based insurance percentage.
  • Greater than 70% of adult immigrant Mexicans had household incomes below 200% Federal Poverty Level (translating into $46,100 or below for a family of four). U.S.-born Mexicans had a lower percentage of 44.3%.
  • Latinos had one of the highest rates of walking regularly on a weekly basis, with Salvadoran being the most frequent walkders at 41%.
  • Almost 27% reported being food insecure, with the highest percentage reported by Salvadorans (37%) and the lowest percentage being reported by South Americans (9.0%)

Joanne Chan, Joint Center Graduate Scholar, Harvard School of Public Health
Limited English Proficient Communities Remain At-Risk for being Uninsured

th

A new report from the Robert Wood Johnson Foundation provides state-level estimates for health insurance status among Limited English proficient (LEP) communities. Using data from the 2012 American Community Survey, the report‘s authors examined data for LEP people aged 5 years and older (e.g., did not speak English very well). Being LEP is common among the insured population, with at least 30 states and the District of Columbia having 10% of its state populations as LEP; California, New Jersey, and New York have nearly one-third of its uninsured population aged 5 and older as LEP.

Report findings indicate that a significant portion of the LEP population remains un- or under-insured. Among the estimated 24.5 million LEP population (approximately 8.6% of the total population aged 5 and above), more than 1/3 were uninsured (9.5 million). Approximately 7.3 million of the LEP population have employer-sponsored insurance, yet this population comprises of only 4.5% of the total population aged 5 and older with employer-sponsored insurance. Clost to 2 million people with LEP purchased insurance directly from an insurer, but this population comprises only 5% of the total population that purchased insurance directly in the individual market. Finally, at least 12% of the Medicaid population aged 5 and above are LEP, with 13 states having a Medicaid LEP population exceeding 10% and two states exceeding 20%).

The authors also highlight that LEP uninsured communities are at higher risk of not enrolling in public insurance or marketplace plans due to limited information provided for recent and undocumented immigrants. Furthermore, many LEP individuals that are uninsured remain at risk of not receiving appropriate in-language services and medical care. Thus, recommendations for health plans, providers, and policy makers include ensuring language assistance services that improve access to care for un and under-insured LEP populations.

Joanne Chan, Joint Center Graduate Scholar, Harvard School of Public Health

Juvenile Incarcerations Are Down, But Disparities Remain

image

The National Council on Crime & Delinquency recently published a report indicating that there has been a significant decrease in the number of juvenile incarcerations. The report attributes this success to bi-partisan legislative efforts such as the following:

• Shifting the responsibility of youth from state to county agencies, including incentives for those changes
• Removing some lesser crimes from the list of categories that make one eligible for state incarceration
• Using research to inform best practices
• Urging stakeholders to make legislation goals that put youth in settings that are the least restrictive

Even with the overall positive changes to juvenile incarceration, youth of color still represent disproportionately more of those who are formally supervised and who are in state detention centers. The report indicates that systematic changes need to be made including the development of effective supervision strategies and guaranteed legislation funding for community research organizations.
Patrice Garnette, Joint Center Graduate Scholar, The George Washington University Law School

Detailed Department of Education Report Shows Disparities Remain in Schools

doeimage

The U.S. Department of Education’s Office for Civil Rights released a recent report which highlights civil rights data in almost every state for the past 15 years.  The information is available through a searchable online database.  The purpose of the report is to highlight the school districts that are making significant improvement in providing equal education for all and to show the areas where the greatest achievement gaps remain.  The report indicates that racial disparity in school discipline is a widespread problem from preschool through high school.  Although civil rights data on schools has been collected since 1968, the system was revamped under the Obama administration to include data on preschools and discipline methods.

Disparities remain in American schools. For example, minority boys and young men are disproportionately affected by discipline methods. To add, there has been and remains unequal access to preschool education.

Other key findings for the report are:

  • Preschool access remains unequal with only 60% of school districts offering preschool programs (most of which are only half-day)
  • Only 18% of preschool students are black, but 42% of them are suspended once and 48% are suspended more than once
  • Black, Latino, and English language learner students are offered access to a full range of Math and Science courses at a disproportionately lower rate than white and Asian students

The goal is for the report’s generated information to inform policy and regulatory changes to address some of the most prevalent problems.

Patrice Garnette, Joint Center Graduate Scholar, The George Washington University Law School


Addressing School Segregation in New York

image


A recent report by University of California, Los Angeles’ The Civil Rights Project/Proyecto Derechos Civiles explains that the state of New York has the United States’ most segregated schools.  Within the state, New York City has one of the most segregated school systems with Black and Latino students experiencing the least amount of diversity in schools where they are the majority.  Only about 10% of majority Black and Latino schools in New York City have white students in their population.  A Huffington Post article notes that 19 of New York City’s 32 school community districts have student populations of less than 10%.   Also, as New York City’s demographics change, school choice programs and policies magnify the problem of racially segregated schools.

About 40 years ago, between changing laws and a community push for change, desegregation of New York schools became a focused effort.  Although some of those efforts yielded changes, the goal to desegregate schools progressively faded as other initiatives related to school choice, charter schools, and accountability systems became key.  Unfortunately, some of the attempts to address school segregations continue to be thwarted by issues such as the following:

  • Residential patterns
  • Lack of commitment
  • Market-oriented framework
  • School policy reversals

Advocating for school integration is still a worthwhile cause because of the prospect of a brighter future with regard to finances and health.  Moreover, the social benefits of pushing for school integration are great in that interaction with other races teaches tolerance and encourages better interracial interactions, diminishing the likelihood of prejudice in the future.


Patrice Garnette, Joint Center Graduate Scholar, The George Washington University Law School


Researchers Find Perception is a Strong Basis for Racial Disparity

image


A new study conducted by New York University psychology researchers examines the role perception plays in increased racial discrimination during economically challenging times.  The study finds that when economic resources become scarce, people’s views of each other become distorted, which ultimately encourages disparate treatment.  This poses a challenge for efforts to reduce racial disparity because generally people are not fully aware of their perceptions.  People typically believe their perceptions are accurate representations of reality, so naturally realizing a need to adjust their perceptions is difficult to do.

 The researchers find that people’s perceptions of racial implications change with a shift in personal social goals and motivations. To explore this theory further, researchers studied the perceptions of non-Black male and females in an experiment. First, the participants completed a survey regarding their views of economic competition between Whites and Blacks.  Then, they looked at pictures of people, some of whose racial backgrounds were largely white or black, and some of whom were of a more mixed racial background.  The participants were asked to identify the people in the photos as being either White or Black.  The results of the test were that those who believed there was a greater racial economic tension were more reluctant to classify the people in the photos as White; whereas, those who believed racial economic tensions were not significant were more apt to categorize the people in the photos as being White.

 In a variation on this same test, researchers flashed subliminal messages to the participants before showing them images of the people that they were to categorize. In this test, even when shown photos of mixed race people who had a higher percentage of Black in their background, participants labeled the people in the pictures as White more often when shown positive subliminal messages before seeing the photos.  Conversely, participants labeled the people in the photos as Black more often when negative subliminal messages were shown before they viewed the photos, even though many of those photos were of people whose backgrounds were significantly less Black.

 The experiment was repeated with other variations. In each instance, the researchers found that perceived biases played a part in the link between economic scarcity and increased discrimination, which ultimately lead to racial disparities.


Patrice Garnette, Joint Center Graduate Scholar, The George Washington University Law School

Sixth Amendment Disparities in Delaware Criminal Courts, Part Three

image


Part Three of The Sixth Amendment Center’s recent report discusses issues of accountability in Delaware’s Criminal Court, which greatly impact minority communities because people of color are involved in the system at a much higher rate than non-minorities.  Delaware’s system does not have dedicated training and supervision for the lawyers representing indigent defendants.  As a result, the defendants do not have adequate representation or advocacy from their public defense attorneys.  For example, oftentimes public defenders only investigate their most serious cases.  Also, the norm in the Delaware Criminal Court is for public defenders to enter guilty pleas for their clients, even though they only meet the vast majority of the clients minutes before the hearing begins.

Those inefficient standards could be addressed by implementing a system of accountability.  That system would need to assess the both the individual attorneys’ practices, as well as the effects of the overall system.  Delaware currently has no monitoring system in place to identify areas of need.  In fact, this report performs the function that the Delaware Criminal Court needs to implement internally when it comes to identifying gaps in the system, overall deficiencies, and overarching problems preventing public defenders from efficiently representing their clients.

The report presents the following overall recommendations:

  • Implement effective ethical screening to promote a cohesiveness among the various areas within the public defense system
  • Making it so that children in Family Court are not allowed to waive their right to counsel
  • Establishing a systematic effort to appoint counsel to indigent defendants as soon as possible and to put in place a system of vertical representation
  • Require standards of adequate representation for clients by training attorneys and monitoring the system’s progress on an ongoing basis


Patrice Garnette, Joint Center Graduate Scholar, The George Washington University Law School


California Reduces Number of Out of School Suspensions for White and Nonwhite Students

Image


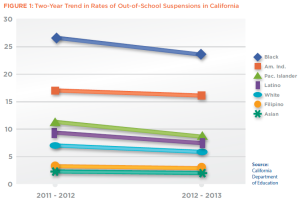
A new study by the UCLA Center for Civil Rights Remedies finds that between 2011 and 2013, the number of out of school suspensions (OSS) has gone down for all students in California. The rate of reduction in these suspensions was nearly 3 in 100 fewer suspensions over the two-year period, with Black students having the greatest reduction (between 11 and nearly 22 in 100 fewer suspensions).  Latinos had between 5 and 12 in 100 fewer suspensions.  The data collected for this study seems to indicate that California school districts have made progress in relying less on out-of-school suspensions as a disciplinary tool.  The data also shows that disparities in racial disciplinary exclusion are narrowing because minority student groups are seeing the highest reduction rates in OSS.  If these trends continue, more students will have access to education without the interference of behavior management issues.

Although it may be too soon to tell what the long-term trend in reduction of out of school suspensions will be, the following California districts made the greatest reduction in OSS over the two year study period:

  • Greenfield Union had just over 15 in 100 fewer suspensions
  • Rialto Unified had just over 11 in 100 fewer suspensions
  • Central Unified had just over 9 in 10 fewer suspensions

To contrast, the following districts had the lowest reduction in OSS:

  • Los Angeles Unified had 1.66 in 100 fewer suspensions
  • Long Beach Unified had 1.66 in 100 fewer suspensions
  • Fontana Unified had 2.75 in 100 fewer suspensions

The report suggests that school districts with the least gains should learn from districts with the greatest gains to determine ways to reduce their OSS even further.

Patrice Garnette, Joint Center Graduate Scholar, The George Washington University Law School


New report estimates the effect of ACA on 14 large and diverse US cities

The Affordable Care Act (ACA) is estimated to provide increased federal funding to all states, but the amount is heavily influenced by the extent of Medicaid expansion and enrollment in federal marketplaces. States that decide not to expand Medicaid will forgo additional federal funds and need to address the needs of their uninsured populations.  Additionally, the ACA will reduce Medicare reimbursement as well as disproportionate hospital share payments. This will pose challenges for areas that serve the uninsured across a wide region. 

Image

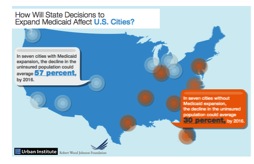
The Urban Institute recently released a report on the ACA’s effect on 14 large and diverse cities. The following cities expanded Medicaid: Los Angeles, Chicago, Seattle, Columbus,  Phoenix, Denver, and Detroit. In these seven cities: 

  • the percentage of uninsured could decrease by 57% on average by 2016
  • enrollment into Medicaid and Children’s Health Insurance Programs (CHIP) will increase 38.5% 
  • a large percentage of those remaining uninsured are undocumented (41.4% in Houston, 28.4% in Charlotte, and 35.2% in Miami)

The following cities did not expand Medicaid: Charlotte, Houston, Philadelphia, Indianapolis, Memphis, Atlanta, and Miami. In these seven cities: 

  • the percentage of uninsured could decrease by 30% on average by 2016 (27% less than the average estimated decline among the seven Medicaid expansion cities).
  • enrollment into Medicaid and Children’s Health Insurance Programs (CHIP) will increase 10.7% (27.8% less than expansion cities) 
  • a large percentage of those remaining uninsured are undocumented (41.4% in Houston, 28.4% in Charlotte, and 35.2% in Miami)

The ACA will impact each city differently based on income, race/ethnicity, and immigration status. For example, approximately 80% of the uninsured population in Miami is Latino while more than 75% of the uninsured in Detroit are Black. Policymakers and researchers will need to observe how ACA will impact each area and address issues as it relates to each different population. 

Joanne Chan, Joint Center Graduate Scholar, Harvard School of Public Health